Foodstuffs North Island fact checker
Last updated Tuesday, 24 May 2022
With 2.7 million customer visits in our stores and online every week, around 330 stores and 24,000 Foodies across the North Island, we play a big role in Kiwis' lives. That's why it matters to us that information about our business is accurate. Your local store is owned and operated by a family who is part of your community so getting the facts straight about their stores, people and customers is something they take seriously. We're up for an honest conversation but we think it's important it's based on facts.
That's why our team have developed this fact checker to check what's said about Foodstuffs North Island and to provide the facts, based on data and evidence.
It's another small but important step towards our goal of becoming one of the most customer driven retailers in the world.
These facts will be regularly updated to provide data and analysis on the issues that matter most to our people and customers.
You can also find detailed information in our publicly available submissions on the Commerce Commission’s market study draft report into the retail grocery sector.
By the numbers
- 330+ stores and 24,000 team members across the North Island.
- 2.7 million customer visits in store and online weekly.
- 9m meals to Food Rescue.
- $50m invested into innovation in 2021 alone.
- 9k new products annually.
- ~$100m per year invested into constructing and refurbing our property across our stores, supply chain, and support offices.
- ~$5.5m annually spent on staff training and development.
Sections:


Pricing, promotions, and loyalty programmes
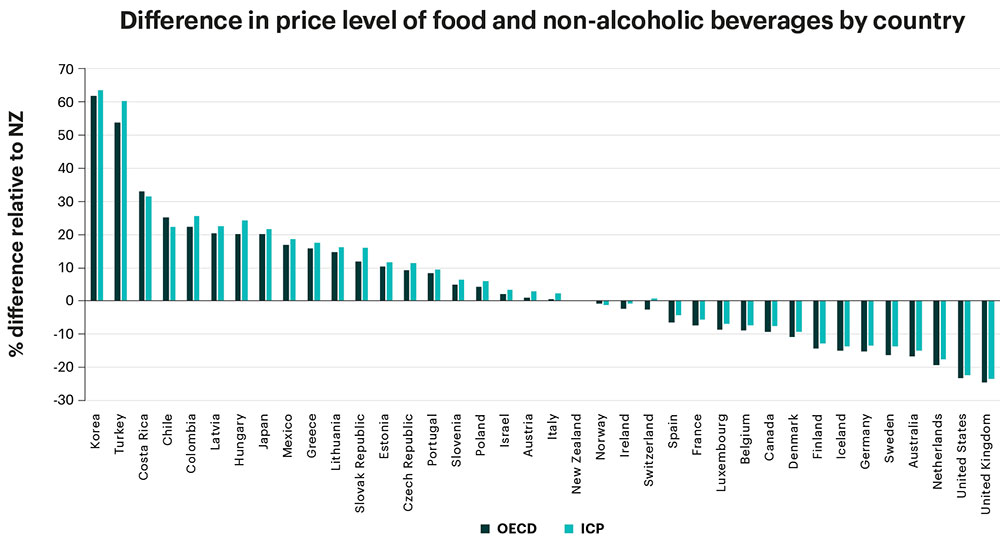
"New Zealand prices are relatively high by international standards." - Claim | In reality, New Zealand grocery prices are fair by international standards when taking into account the purchasing power of the New Zealand dollar versus other currencies. According to the OECD, New Zealand grocery prices rank 21st (in the middle of the pack - see below graph) when using the Purchasing Power Parity comparison. |
- Our population is a lot smaller compared to countries such as the UK, US, or Australia. Supplying groceries to larger populations provides economies of scale, resulting in lower prices for customers.
- Our geographic isolation relative to other OECD countries increases the cost of transporting goods and input materials.
- We have a very comprehensive GST in NZ (for example Australia has GST rate of 10 percent, for which most of food and grocery items are exempt).
- Many of the countries outperforming NZ in the OECD ranking are members of the European Union, or otherwise enjoy free trade with the European Union, which New Zealand does not. The European Union also provides a farmer subsidy scheme to increase supply.
- The price of New Zealand goods is often influenced by the level of export demand. For example, 85% of NZ red meat is exported. These high-demand cuts are sold at a premium overseas which results in the pricing of meat sold domestically being strongly influenced by the price at which it is sold overseas.
- The cost of labour may be higher in New Zealand due to factors that affect the demand or supply of labour, e.g., many of the OECD countries with lower prices have a greater supply of labour than in New Zealand, including through immigration.
"Supermarkets are driving up the price of food and groceries." - Claim | It is true that the price of food and groceries, like many consumer goods, has increased in recent years, however there are several factors that influence the price that customers pay for food and groceries. We explore some of those in a little more detail below. |
InflationInflation represents a general increase in overall prices, and there are many contributing factors including the global price of key inputs (e.g. oil and labour), policy decisions and the supply of money circulating in the economy. A small amount of inflation is typically expected and since Sept 2002, the Reserve Bank of New Zealand’s inflation target has been in the range of 1-3% annually. Over the last ten years annual the Food Price Index (FPI) has been below the Consumer Price Index (CPI) in 26 of the 40 quarters (65% of the past decade).In the last four years (2018 - 2022), CPI year on year growth has averaged at 2.7% while FPI has averaged at 2.8%. Most recently (in the quarter ended March 2022) CPI was 6.9% and FPI was 7.6%, illustrating that inflation in the past year has been much higher than the last four years. It also tells us that the food sector has been impacted more greatly than many other industries, with food price inflation having risen more than general inflation in the last year. It’s not just the price of food that is suffering however, but the average price of everything.The figure below shows the change in prices, split by CPI (red line) and FPI (black line). It also shows the groupings of the FPI, represented by the five other lines. This highlights the relatively similar levels of inflation experienced in the CPI and FPI, as well as the high variability of the price of fruit and vegetables – which is very seasonal.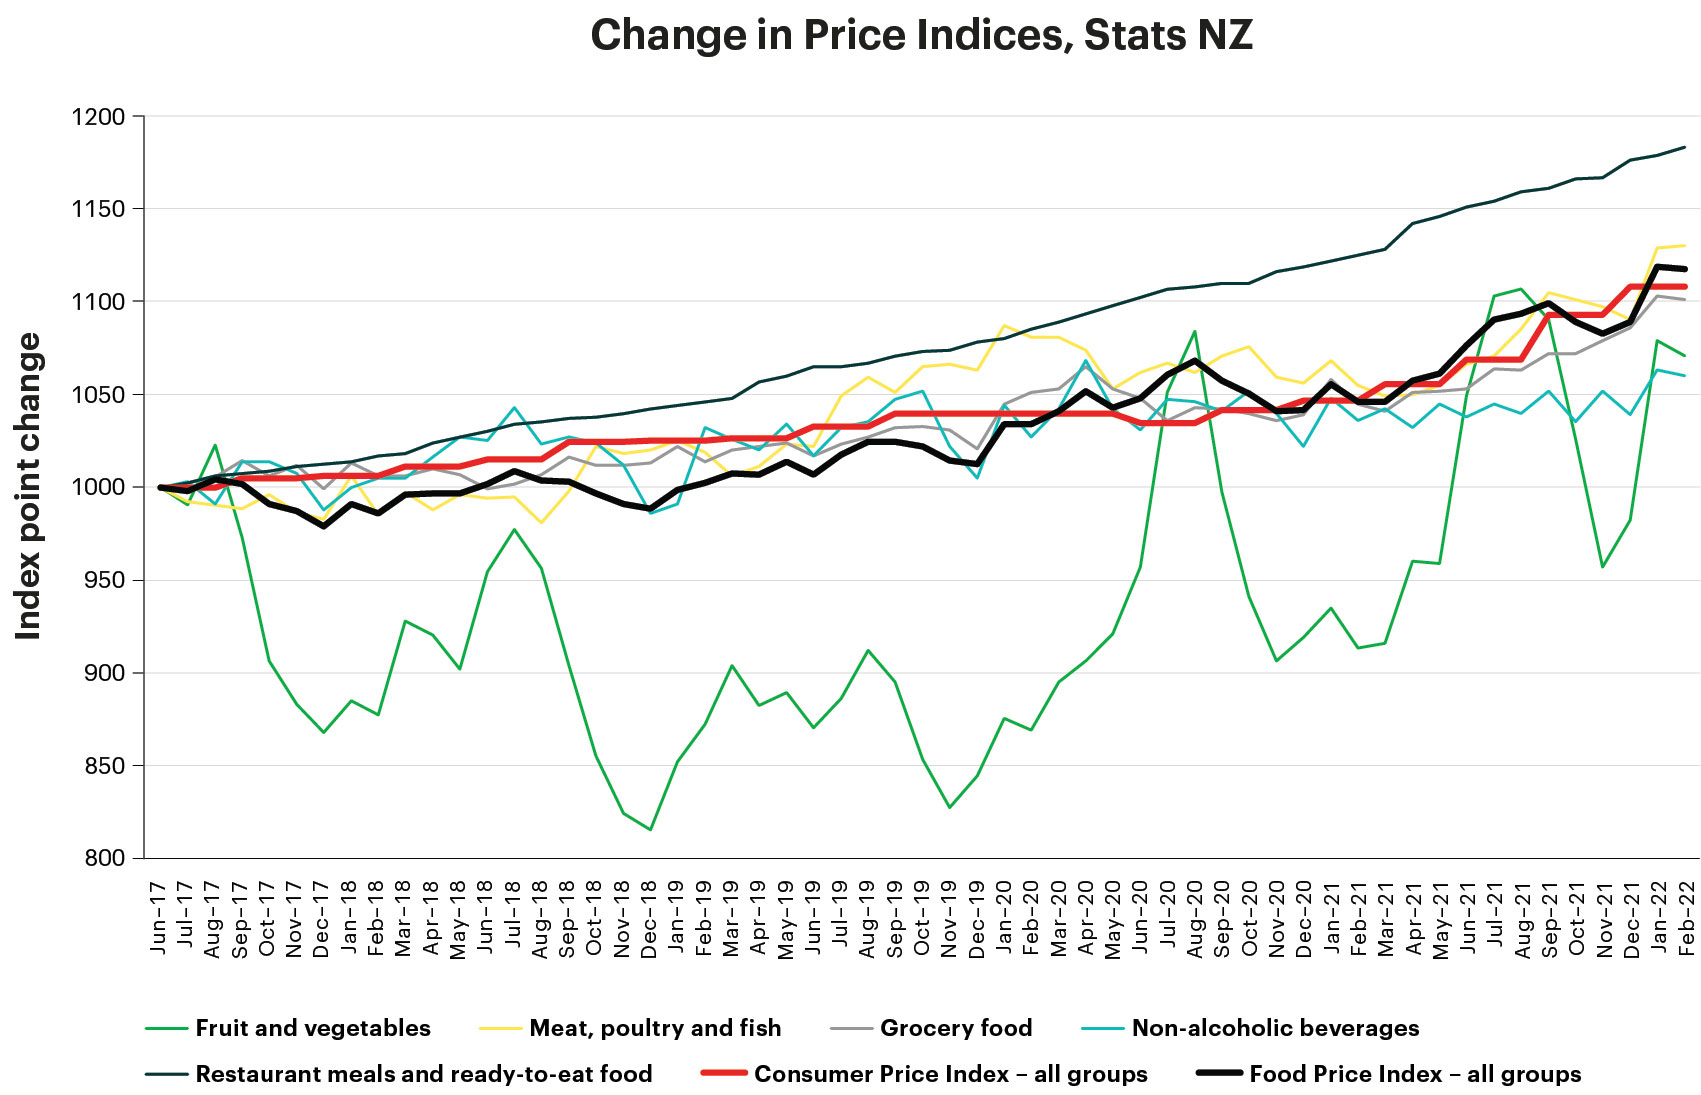
“Prices are being misrepresented and manipulated.” - Claim | Pricing and the different types of promotions can be confusing, especially when retailers do things differently. We strive to provide the best possible value to our customers and have committed to simplifying our pricing and promotions. |
Work is underway to reduce the different types of pricing tickets, and we are moving away from more frequent use of promotions to introducing more products at every day low pricing (EDLP).
We know from our own customer survey on our action plan (released as part of the response to the Commerce Commission's market study into the retail grocery sector) that 71% of customers say simplifying pricing and promotions is the action that will make the biggest difference to them and 67% say consistent use of unit pricing is next most important.
We also agree with the Commerce Commission’s recommendation in its final report to mandate the consistent display of unit pricing, using the Australian code as a starting point – it helps consumers to make informed purchasing decisions. The actions outlined in our plan in relation to pricing and promotions will deliver value for customers by improving their ability to make informed shopping decisions.
Profitability
“The supermarket industry is making excess profits of more than $1 million per day.” - Claim | We don’t make excessive profits. As outlined in more detail below, the final report from the Commerce Commission was clear that supermarket returns in New Zealand were similar to those of other international grocery retailers in highly competitive markets like the UK, America and Europe. |
The more than $1 million a day in excess profits claim is wrong because it’s based on the assumption that a business making a ‘normal’ return should only be covering their average cost of capital – on that basis no business would invest in New Zealand. We invest $150 million a year in innovation and new stores for customers. That would not be possible under this ‘break-even’ approach.
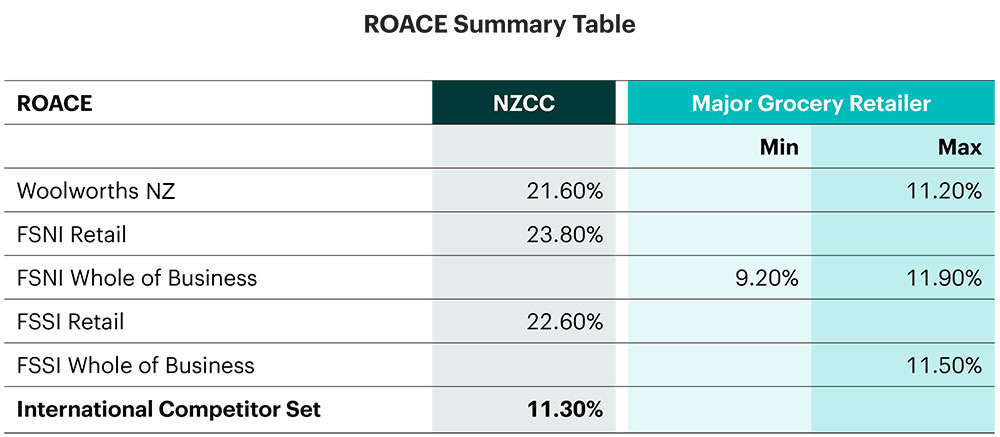
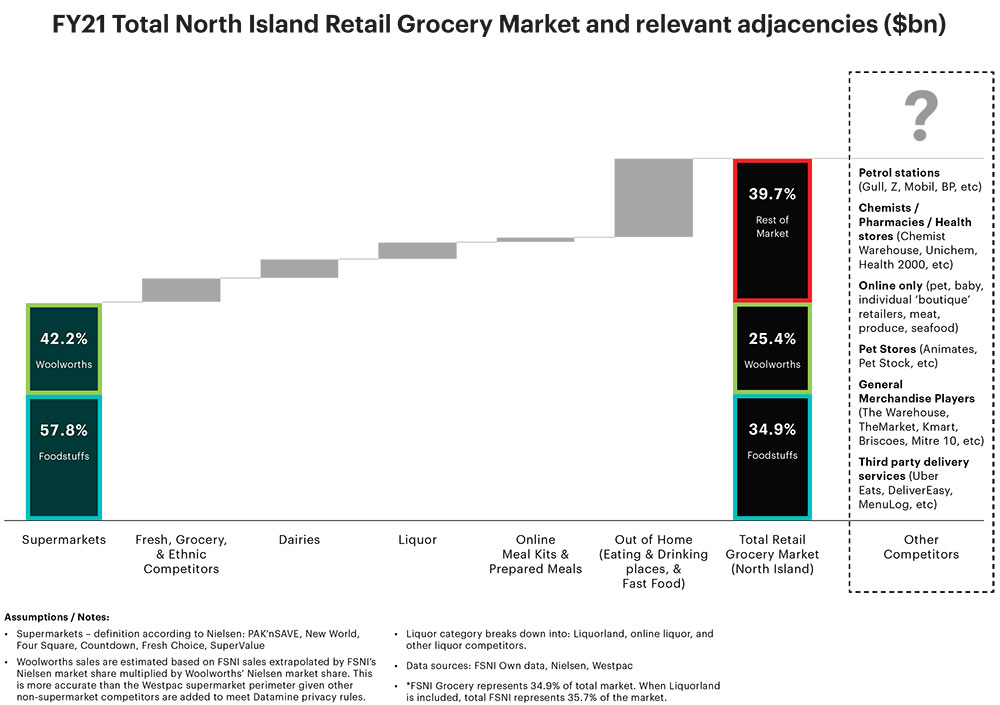
“Foodstuffs North Island's profitability is excessive.” - Claim | In its final report, the Commerce Commission calculated our Return on Average Capital Employed (ROACE or “return on capital”) – a measure commonly used to compare relative profitability of companies – to be around 13.1%. |
The Commission also found that the NZ major grocery retailers’ returns were broadly consistent when compared to the sample of overseas grocery retailers (ref 3.57 of the Commission’s final report).We agree with this finding and are pleased that the Commission corrected its estimate of our ROACE from its earlier estimation in its draft report of 23.8% to 13.1%. In its draft analysis, the Commission attempted to separate our business into two parts being retail stores and the co-operative (supply chain, our support centre and all other parts of our business that are critical in running a vertically integrated grocery retail business), and in doing so made a number of material errors in its calculation.The main errors in the Commission’s draft analysis were that it had incorrectly calculated the correct amount of capital funding to remove from the retail part of the business, and it had not allocated the retail land and buildings to the asset base. Although it is difficult to calculate, we corrected these errors and shared our models with the Commission. This is shown in the bridge below. Correctly calculated, the return on capital for the retail part of our business alone is around 9-12%.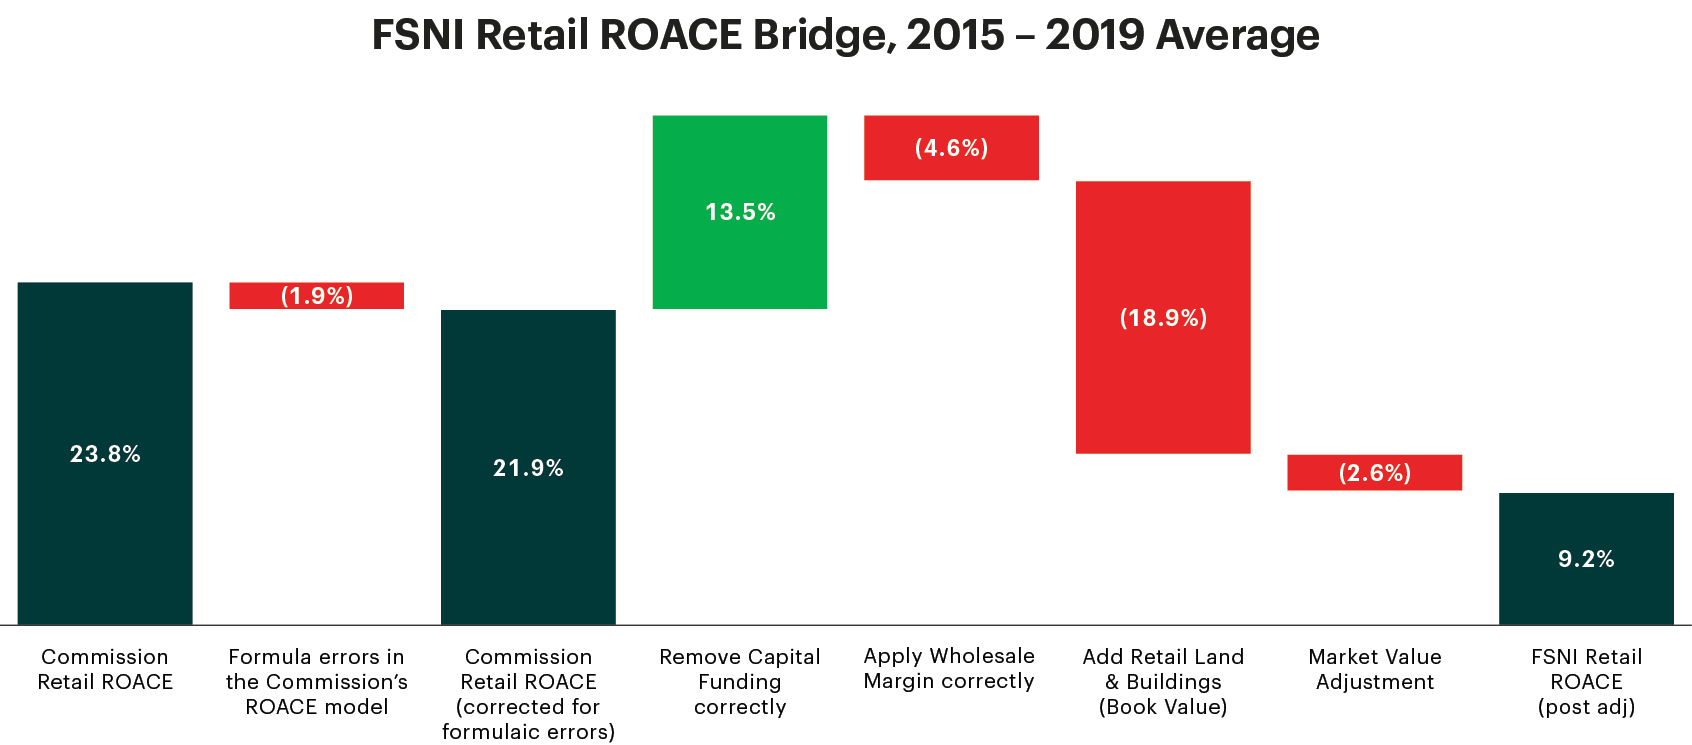
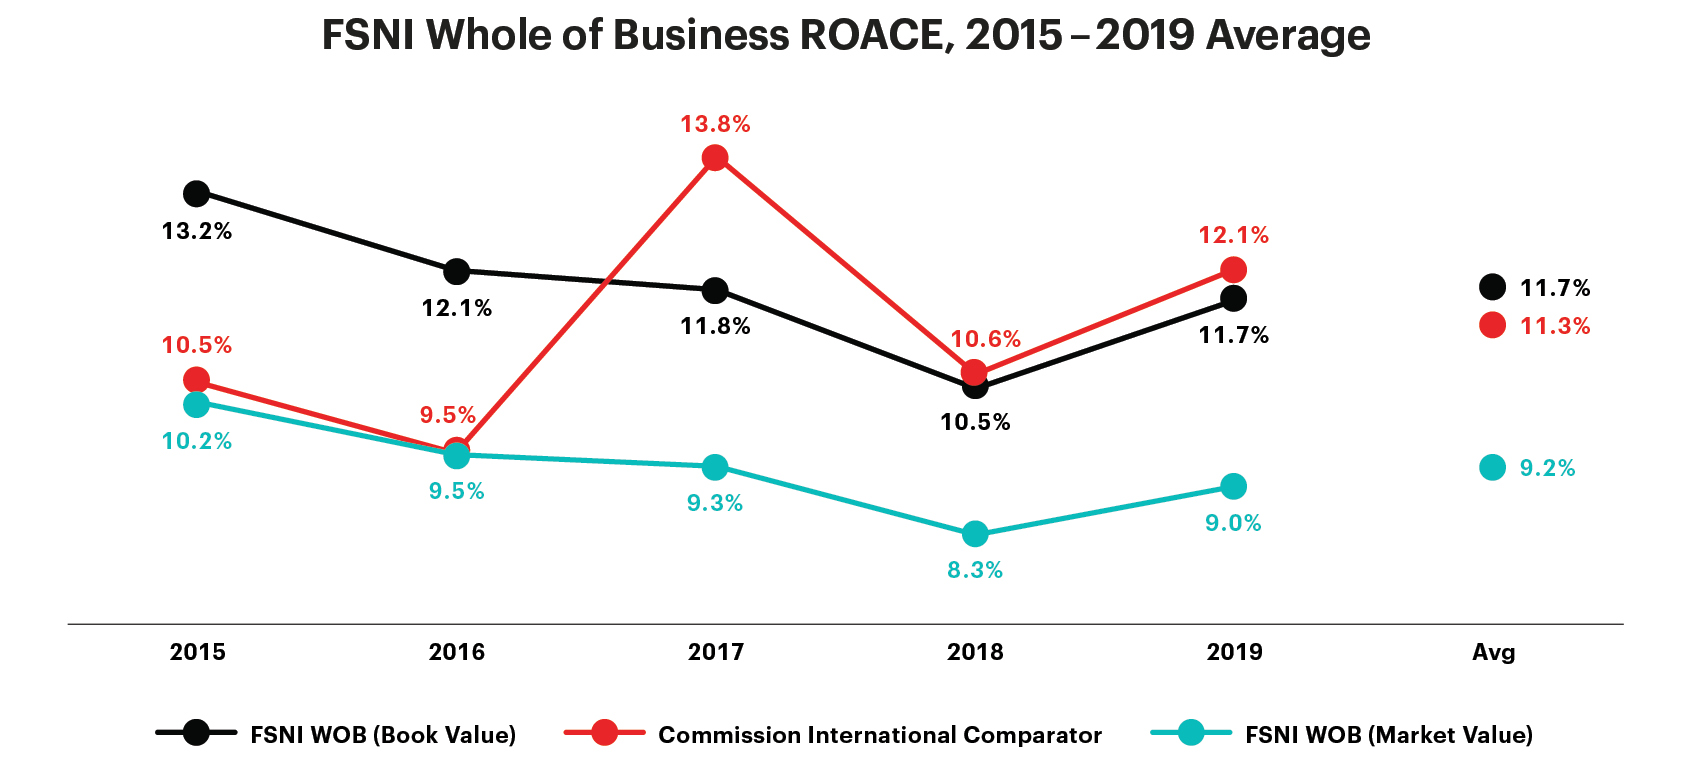
As noted, the Commission agreed that the NZ major grocery retailers’ returns were broadly consistent when compared to the sample of overseas grocery retailers.
Regardless of this, in its final report the Commission stated that the returns of the New Zealand major grocery retailers were still higher than it expected when comparing to its estimate of a “normal” rate of return of 5.5%, being the weighted average cost of capital (WACC).
The Commission stated that if the NZ major grocery retailers’ average ROACE was 5.5% (being the Commission’s estimate of “normal” returns), the combined profits of the major grocery retailers would reduce by $430 million per year (ref 3.54 of the Commission’s final report).
We disagree with this view, as WACC should be considered a “minimum” return for any business (not a “normal” return) as this is only covering its average cost of capital and, as such, is not an appropriate benchmark.
We maintain that our returns are not excessive when compared to the Commission’s sample of overseas grocery retailers, of which all operate in highly competitive markets in North America, UK and Europe.
Suppliers and products
“Exclusivity deals mean I can’t stock my family’s products.” - Claim | Foodstuffs North Island has no exclusivity provisions or restrictions that would prevent another grocery retailer from selling wholesale or retail Mr Chips branded products or Balle Brothers vegetables. |
"Foodstuffs is pursuing a ranging strategy to reduce the number of products and consumer choices." - Claim | Our customer driven range reviews are about ensuring we have the right products, at the right value and always available, for the 2.1m customers who purchase from us every week. These reviews are part of our customer driven business transformation journey, and it’s about making sure we are constantly modifying our range to suit changing customer preferences, based on what we know about the way customers are shopping. |
Our range reviews are not driven solely by profit or margin but are guided by customer data and insights to help us understand customer needs, customer loyalty, and brand loyalty. Our goal is to make the customer experience better. We make sure that we have addressed all customer need states and shopping missions, and then look at which products don’t meet these needs, or which are highly substitutable and consistently second choice. This opens up space for the products which matter most, to ensure they are available and improve the customer experience. Through all of this, we continue to range a very large number of products. We range 81,812 different products across all our brands (PAK’nSAVE, New World, Four Square and Gilmours). We also process a high volume of new product developments every year. For example, in 2020 we introduced a total of 9,014 new products across our stores and discontinued 3,845 – a net increase of 5,169 products.We reject claims that there is any particular strategy or practice of deleting popular products of brand leaders. As outlined above, our shelf allocation decisions are driven by the customer drivers for convenience and value, which make it easier for our customers to shop our stores by ensuring the range on offer is easy to choose from, represents the products that matter most to them, and represent value to all customers including our price conscious customers. We are constantly making ranging decisions and assessments based on customer data (and subject to a number of considerations, including how we respond to competitive supplier activity, innovation within the relevant product category and developments in other product categories). Given the finite shelf space and the very significant pipeline of new products being developed, deletion decisions are made from time to time (often with input from suppliers) even where products are not performing poorly. Source: Foodstuffs North Island internal data.
"This reduction in products and consumer choices is to the detriment of local NZ suppliers." - Claim | As a 100% Kiwi-owned co-operative, we proudly support many local suppliers. A portion of the range in each store is left to the owner to tailor for their local community, allowing them to show off the local suppliers in their area. Our local NZ supplier base also provides a supply chain advantage, as there is generally less risk compared to importing products (especially given the supply chain issues we are seeing globally due to COVID-19). |
As an example, following our recent frozen food category review there are 132 suppliers, and 93% of the suppliers manufacture in NZ or are NZ-owned businesses.We also support NZ through our own brands: Pams and Value. Overall, about 70% of all our own brands' sales are from NZ suppliers. The next largest country of origin is Australia, making up about 8% of sales.We are also proud supporters of FoodStarter, a competition for small FMCG and start-ups with an innovative product. We’re involved in providing winners of the competition with business and start-up support, so they can start-up or upscale to take their place on New World shelves.Source: Foodstuffs North Island internal data.
"Private label only benefits retailers and provides no value to customers. It’s also unfair to suppliers." - Claim | Private label is just one choice among many on our shelves, and we are dedicated to making sure it’s a good choice for our customers. Our customer driven range reviews look at private label in the exact same way as supplier branded products. If there isn’t a clear customer need for it, you won’t find it on the shelf. |
Compared with most overseas markets, we have a relatively low amount of private label products in our total range. This reflects the relatively strong supplier bargaining power and brand attachment of Kiwi consumers. According to Nielsen data, the weighted global average dollar share of private label is 16.5%, with many European countries enjoying dollar share between 22-45%. This compares to NZ’s average dollar share of just 14%. 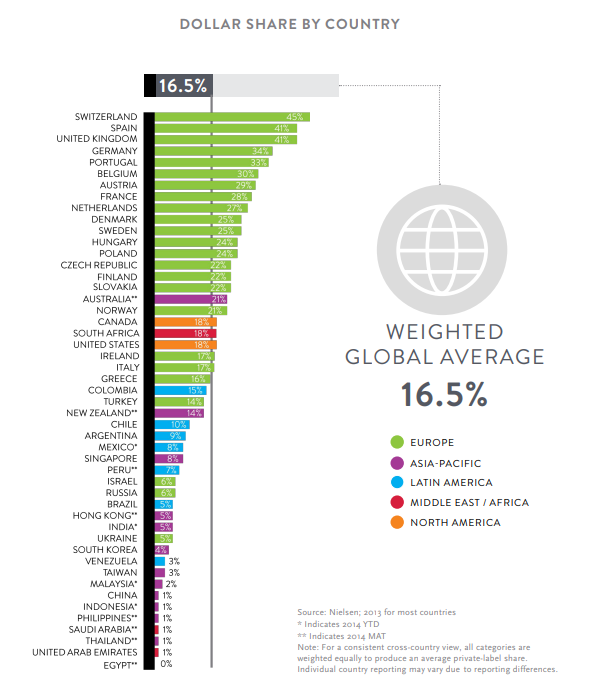
- Reducing our carbon emissions
- Minimising our waste
- Improving our packaging sustainability
- Responsible and ethical sourcing
Competition in the retail grocery sector
“Supermarkets could seek to profit from the proposed ban on restrictive land covenants.” - Claim | Foodstuffs North Island will not be seeking compensation from landlords as a result of this law change. We made the commitment last year to end the use of restrictive land covenants and exclusivity provisions in leases, and immediately started a process to remove all existing such clauses. While that process is underway no covenant or exclusivity provision has or will be enforced. |
We are publicly reporting our progress on our Market Study Dashboard. To date, 78 of 135 restrictive covenants have been removed, the remaining covenants are registered on land we no longer own and we are approaching the owner of each parcel of land to remove these. Where we do not have the agreement of land owners to remove these, The Commerce (Grocery Sector Covenants) Amendment Bill removes that requirement so we welcome it to expedite this process.
"There have been no new grocery market entrants since 2004." - Claim | We have seen many new entrants into NZ over the past 20 years, with many being established in the past few years. |
Some notable examples include:
- Farro (2006) – A high-end grocer that specialises in New Zealand-produced artisan food. It offers a wide range of local and internationally sourced ingredients. It is a New Zealand owned and operated business, currently operating six stores across Auckland.
- My Food Bag (2013) – A New Zealand meal-kit company, with an annual revenue of $190m in FY21. As part of its IPO in March 2021, My Food Bag signaled its intention to expand into grocery.
- WOOP (2015) – A New Zealand owned and operated meal-kit business which opened in 2015.
- The Source Bulk Foods (2016) – Provides a range of bulk wholefoods, healthy snacks and organic goods as well as sustainable personal and household products. Currently has six stores throughout New Zealand and is also available for online delivery.
- GoodFor (2017) – A refillery for pantry and household goods. Currently has 7 stores throughout New Zealand.
- HelloFresh (2018) – International meal-kit company based in Germany. NZ revenues of almost $194m in the 2020 financial year to December (compared to $75m the prior year).
- Circle K (2018) – American-based retailer with global revenues of over $50b. Circle K has opened four stores in Auckland and has confirmed plans to open more than 100 New Zealand outlets.
- Honest Grocer (2020) – An online grocery delivery service that sources and supplies New Zealand produce, direct from the farmers and growers.
- Supie (2021) – An online, membership-based supermarket which launched in Auckland in May 2021. Supie has intentions to expand to additional New Zealand regions.
- This Local Piggy (2021) – An online grocery provider which enables customers to order items from local retailers. The service is a way of connecting communities and keeping suburbs unique by supporting their independent stores.
- Four Candles (2021) – A new, premium grocery store which promises quality food, fresh produce and an excellent range of wines and beers that are “fairly priced”.
- Mackzan (2021) – An online grocery platform launching in Auckland.
- Geezy Go (2021) – An online supermarket which focuses on fast delivery to customers, plans to open in Auckland and subsequently Wellington. Geezy Go is already established in Australia.
"The level of innovation in the sector is modest by international standards." - Claim | Given the smaller size of the New Zealand economy and population, it is inevitable that innovation will not progress at the same pace and scale as much larger countries – it’s simply not feasible due to cost, size, location, and demand. |
Despite this, we’re really proud of the innovations we have developed. This year alone, we are investing $50 million into innovation. And for us this has been focused on improving the customer shopping experience:
- Online shopping (delivery, Click & Collect and drive-through offerings).
- Mobile checkouts and apps to connect to personal shoppers.
- New packing alternatives that improve freshness and reduce environmental impact.
- Technology improvements that speed-up checkout times.
- In-store experiences such as Zoom Trolley (which allows customers to scan and pack their groceries as they shop).
- Delivery of innovative store designs such as smaller store formats (Metros), cut-throughs in large stores to compete for quicker shopper missions, and self-service.
- Development of Fresh Collective, a small format store with an emphasis on showcasing quality produce, meat, cheese and deli products, baked goods and wine.
- Developing, trialling and refining meal kits – a new product offering – in response to the entry of meal kit providers.
- A range of recipe builder options, which reduce the burden for customers of having to plan their dinner meals.
- UberEats partnership to allow customers to purchase groceries from our stores and have them delivered via Uber (Auckland and Wellington trial in November 2021).
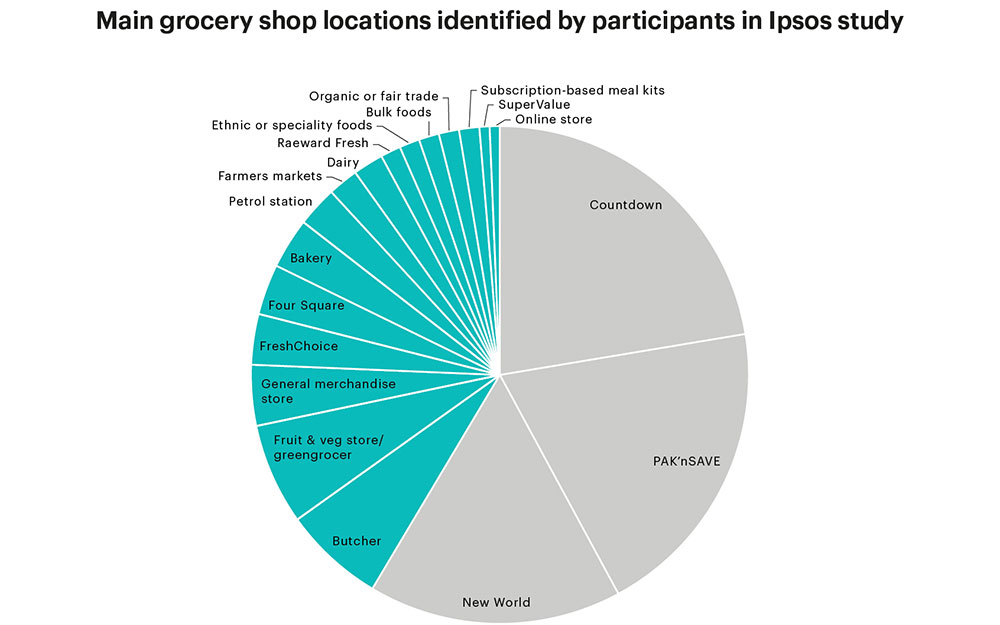
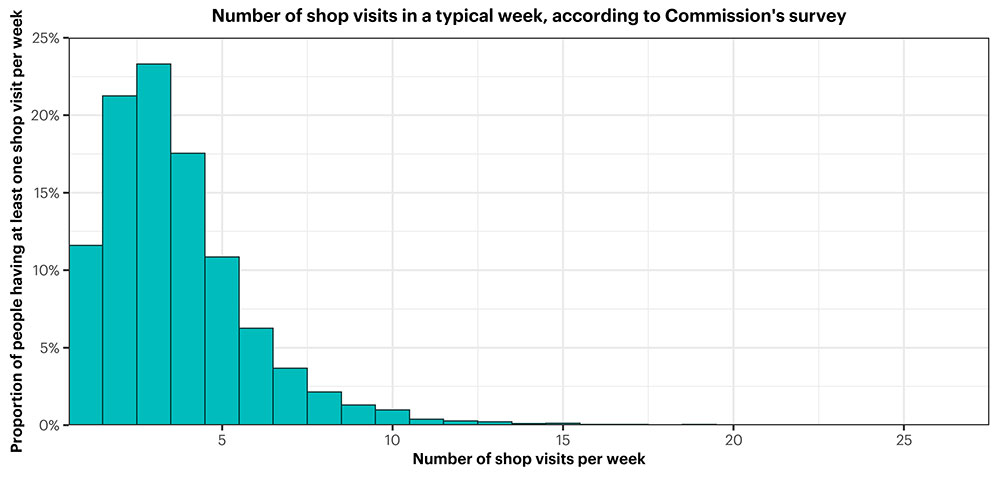
"Most consumers regularly carry out a main shop from one supermarket." - Claim | Our internal data shows us that customer shopping behaviour has changed from the traditional ‘one big shop’ to ‘missions shopping’ (several small trips to different retailers to fill specific needs). |
In addition, the survey data the Commerce Commission has published shows customers carry out several shops per week from a range of different stores each week:
- On average New Zealand customers complete 3.7 shops per week.
- Only 12% of customers carry out 1 shop each week.
- 24% of customers visit just one store per week.
- 40% of customers visit other retailers as well as the major retailers.
“Supermarkets are making it difficult for new businesses to enter the market by using restrictive land covenants and exclusivity provisions in leases, or land banking.” - Claim | We are working to remove the genuine barriers to market entry that are within our control and have committed to ending the use of restrictive land covenants and exclusivity provisions in leases. We are no longer including or accepting the inclusion of restrictive covenants or lease exclusivity provisions for new property transactions. |
We are progressing with the removal of existing restrictive covenants – we have already released covenants from 78 out of 135 titles. So far 58% of all affected titles have had covenants removed and the remaining covenants are registered against land that we no longer own – we are approaching the owner of each parcel of land to remove these where needed. We are also working through a process of reviewing and taking steps to proactively agree variations to leases to remove exclusivity arrangements. Our cooperative does not land bank. We must take a long-term view of our property portfolio and development and all the land we invest in is to unlock sites for future Foodstuffs stores around the North Island.